

Recently I launched a new project called Frontier Log to compile everything happening in AI as data, and organize it in a structured way (events, models and benchmark scores).
One benefit of having organized data is that I can do deeper quantitative analysis to uncover insights and write great stories.
That aligns with the goal of The Ground Truth newsletter as well, so I will be posting interesting stories based on analysis of data from Frontier Log in this newsletter.
The Harness Is Part of the Score
One interesting detail quickly emerged as I was compiling data for various benchmarks. Labs, often open-weight ones, report multiple scores for coding benchmarks obtained by using different harnesses (agents).
This got me wondering: how much impact does the harness have on the coding performance of a model? It turns out the impact is quite large. I compiled the per-harness scores into a story on Frontier Log, and there are 3 angles to look at it.
1. Same Model, Different Harness
If we compare the reported scores for the same model on the same benchmark, we can clearly see the gaps between harnesses. The gap goes up to 8.2 points on one benchmark.
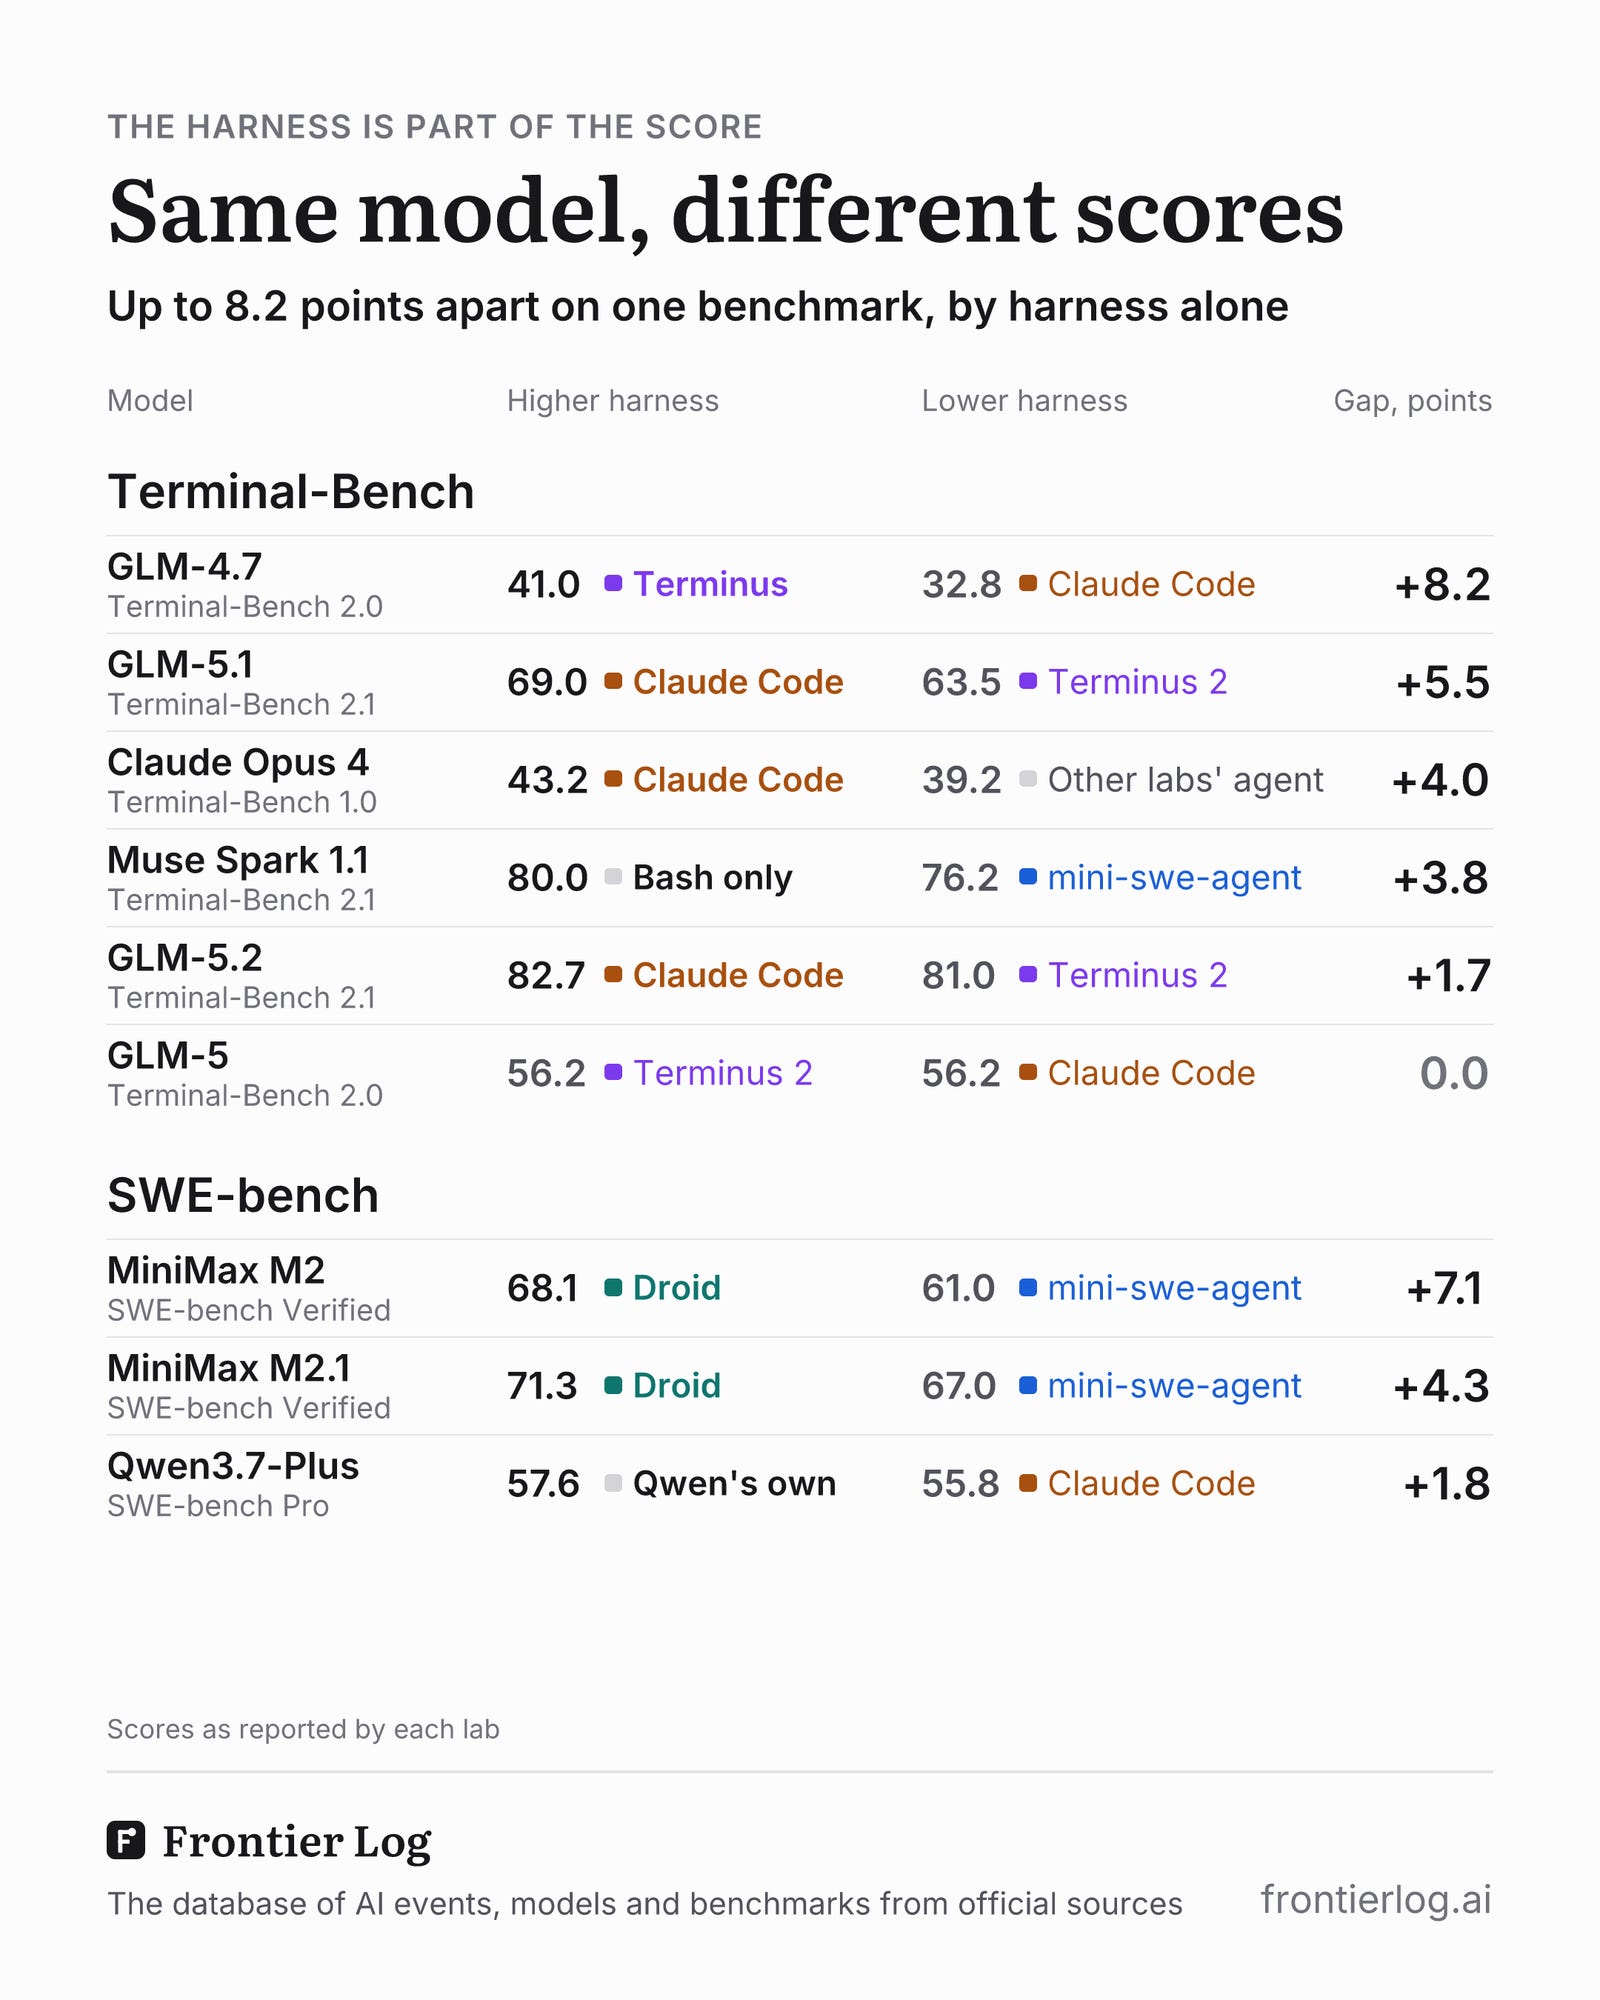
The GLM series from Z.ai shows how the order can flip:
Terminus, the harness built by the Terminal-Bench authors, scored 8.2 points higher than Claude Code for GLM-4.7 on Terminal-Bench 2.0. But on Terminal-Bench 2.1, Claude Code led Terminus 2 for GLM-5.1 (+5.5) and GLM-5.2 (+1.7).
This data also suggests that there is no total order of harnesses. Which harness scores higher depends on factors like the model and the benchmark (the tasks).
2. One Model, Six Harnesses
Another perspective is to zoom in on one model.
NVIDIA ran Nemotron 3.5 Super in six agent harnesses for both SWE-bench Pro and Terminal-Bench 2.1, and published the results in its model card.
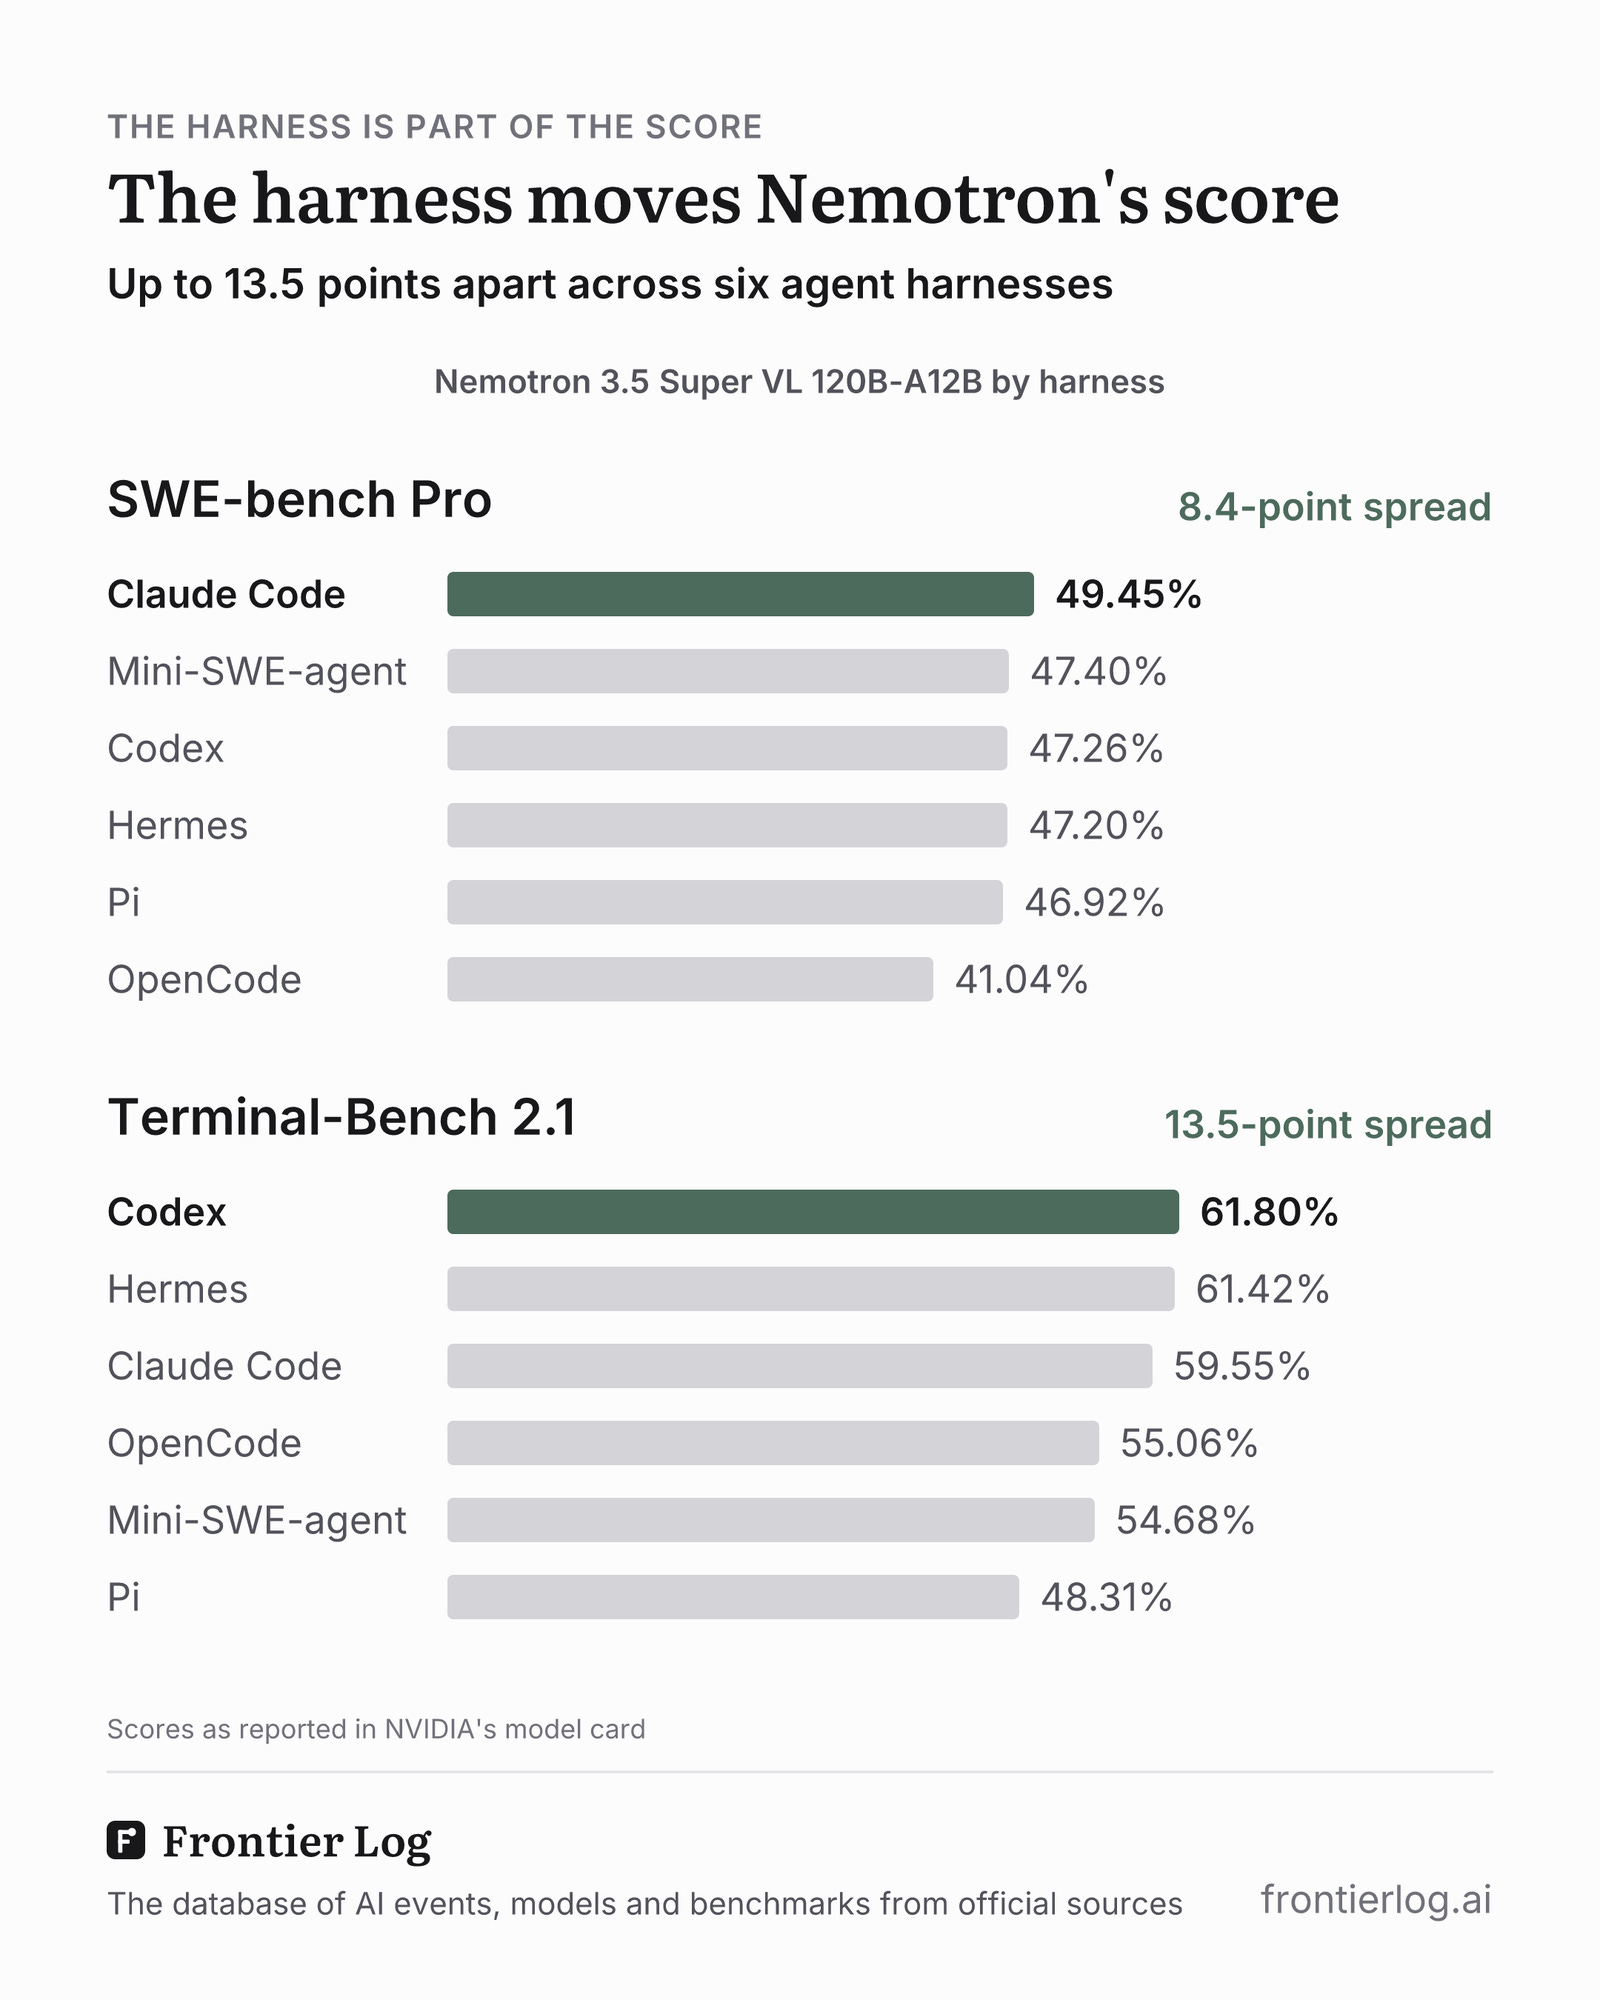
For the same model and benchmark, the harness moves the score by 8.4 points on SWE-bench Pro and 13.5 points on Terminal-Bench 2.1. But again, there is no total order of harnesses, even for the same model:
Claude Code + Nemotron 3.5 Super was top for SWE-bench Pro but third for Terminal-Bench 2.1
Codex + Nemotron 3.5 Super was top for Terminal-Bench 2.1 but third for SWE-bench Pro
3. Which Harness Lifts a Score
Patterns do emerge, however, when we compare a lab’s own harness with the others. If we focus on harnesses and analyze their effect across benchmarks and models, we can see some interesting trends:
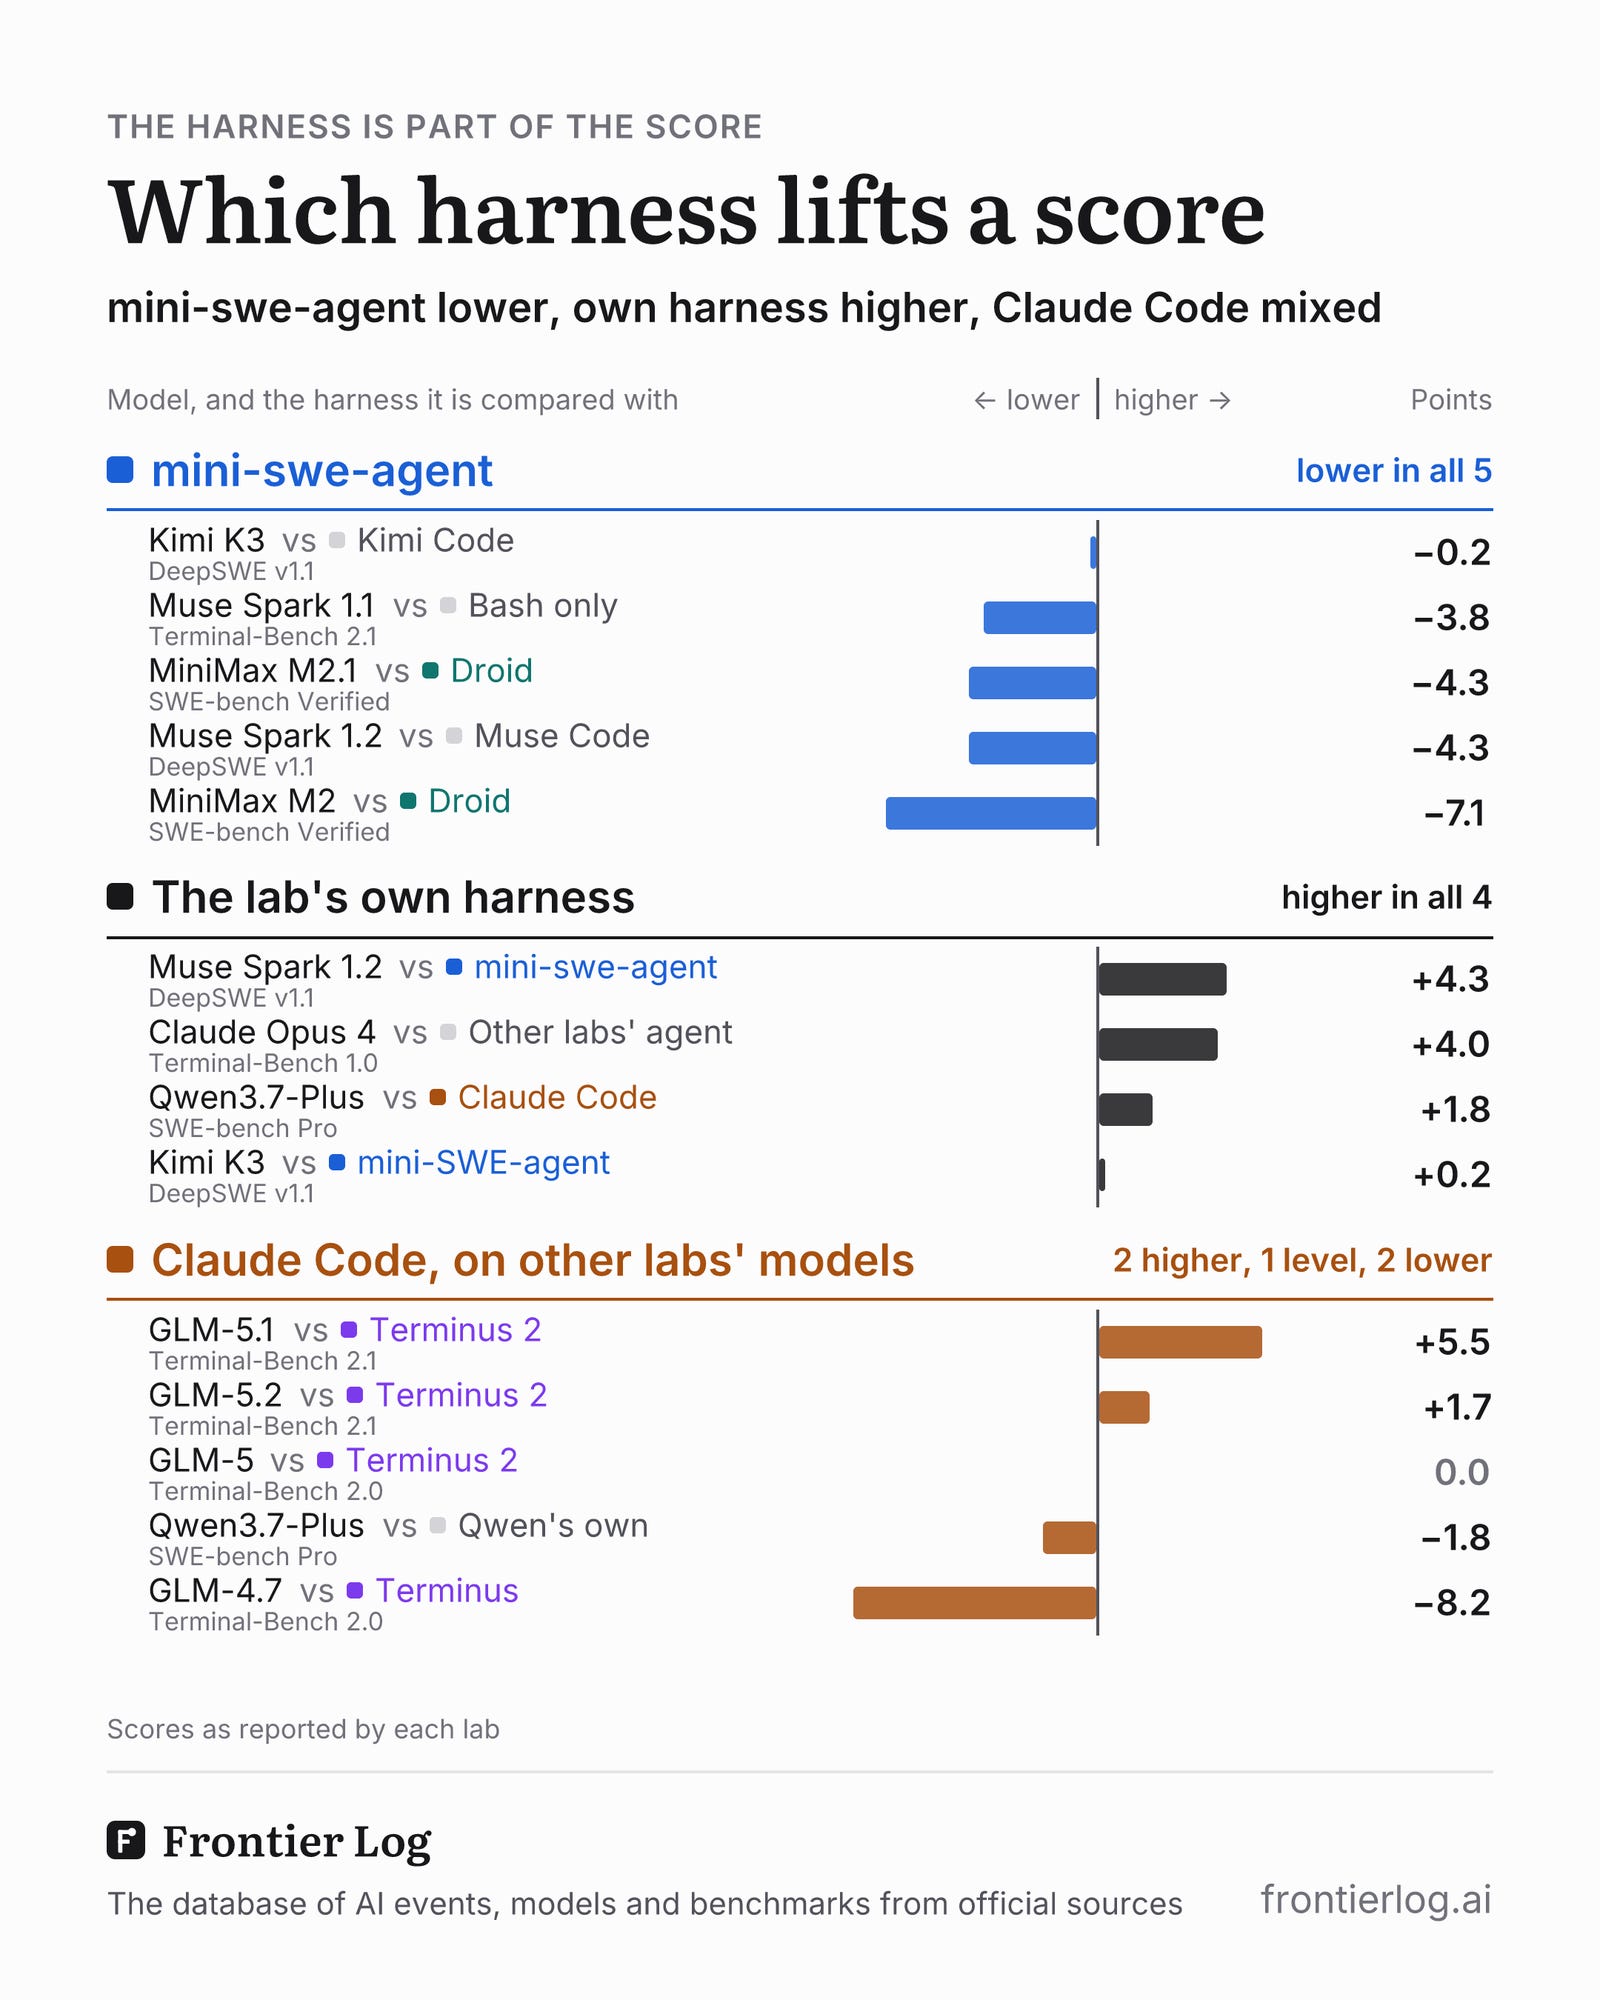
mini-swe-agent scores lower than the lab’s preferred harness in all 5 pairs, by 0.2 to 7.1 points
A lab’s own harness scores higher in all 4 pairs, by 0.2 to 4.3 points
Claude Code (on other labs’ models) swings in both directions
The sample is small, so treat this as a direction rather than a precise measurement.
I can think of two possible explanations for the trends:
Training on the harness. Labs may do RL on their own (or preferred) harness instead of the harness provided by the benchmark authors. mini-swe-agent was built by the same team who built SWE-bench, so it may simply be less familiar to the models.
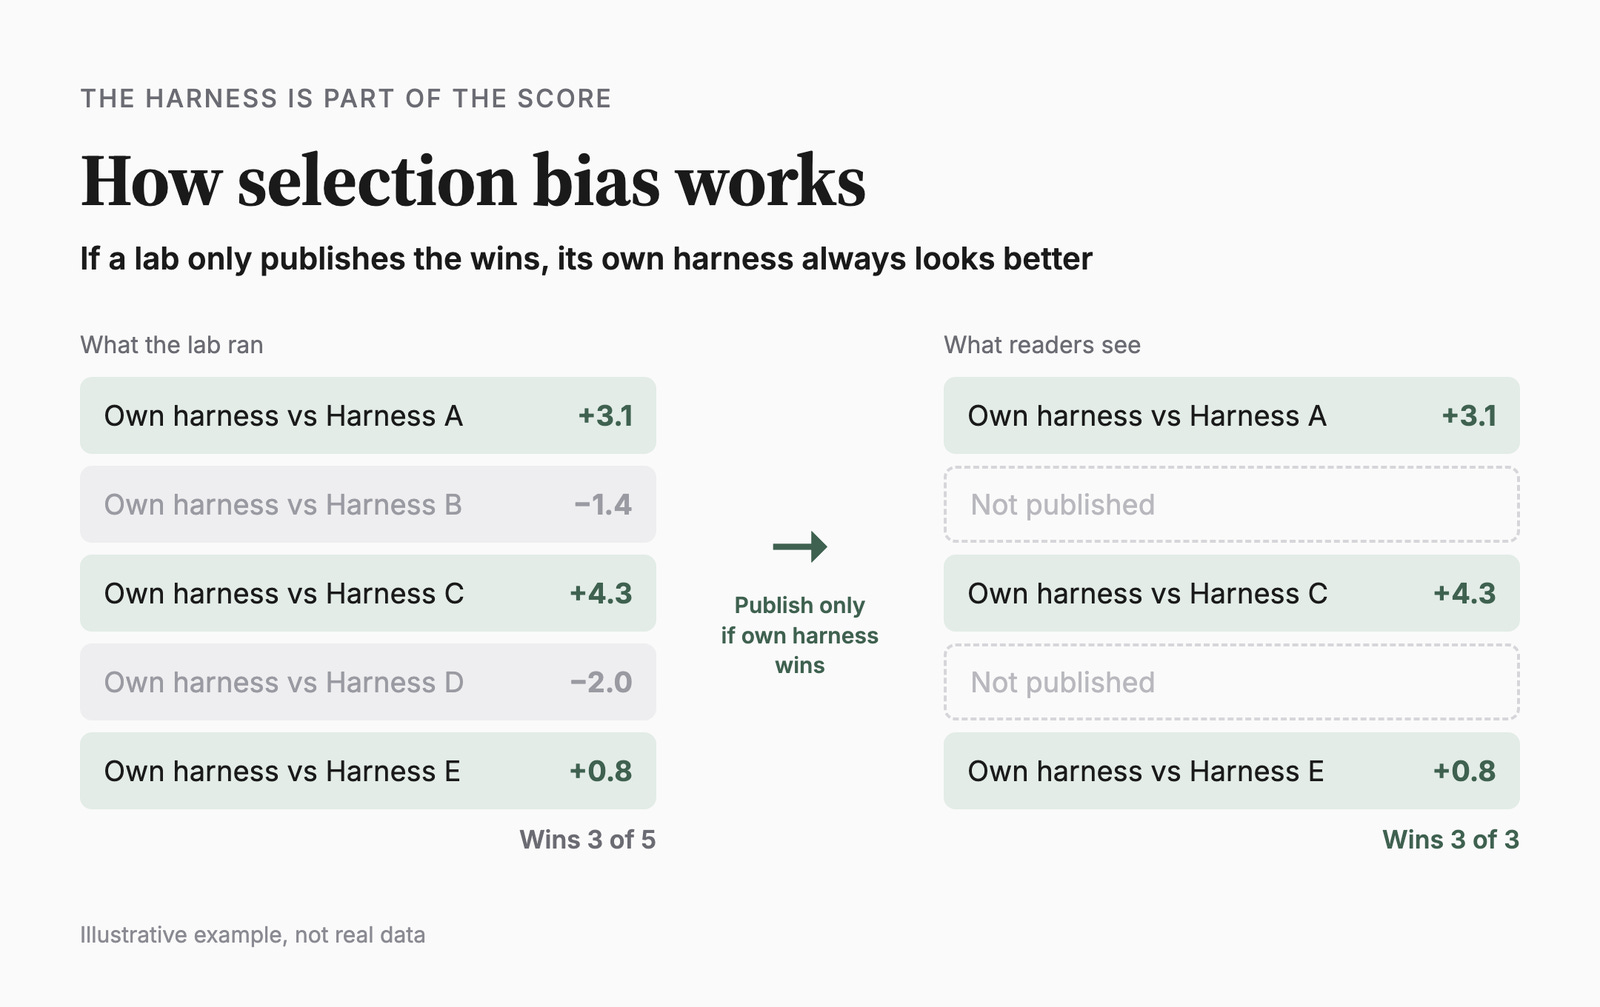
Selection bias. A lab that builds its own harness wants to promote it. So when the lab’s harness wins, the lab has a reason to publish the comparison. When it loses, the lab can leave that comparison out. Over time, the published pairs will lean towards the lab’s own harness winning.
I think the main takeaway from this story is to consider the harness when looking at benchmark results, and be suspicious if it is not reported.